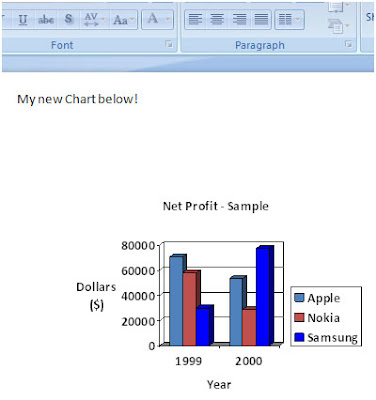
'CREATING a chart in Powerpoint and MANIPULATING it.
Set obj_Pre = obj_ppt.Presentations.Add()
Set obj_Slide = obj_Pre.Slides.Add(1,12)
AddTextbox(Orientation, Left, Top, Width, Height)
obj_Slide.Shapes.AddTextbox 1, 30, 20, 600, 20obj_Slide.Shapes(1).TextFrame.TextRange.Text = "My new Chart below!"
‘Adding an OLE Object of type chart
set ogp = obj_Slide.Shapes.AddOLEObject (100, 150, 400, 300, "MSGraph.Chart")Set grph = ogp.OLEFormat.object
grph.ChartArea.Font.Size = 18
grph.Application.Update
‘Get all chart types here - 'http://msdn.microsoft.com/en-us/library/bb241008%28office.12%29.aspx
‘but for this code we are not defining any chart type and using default.
'grph.ChartType =58grph.Axes(1).HasTitle = True
grph.Axes(1).AxisTitle.Caption = "Year"
grph.Axes(2).HasTitle = True
grph.Axes(2).AxisTitle.Caption = "Dollars ($)"
grph.HasTitle = True
grph.ChartTitle.Text = "Net Profit - Sample"
grph.ChartTitle.Font.Size = 18
grph.ChartArea.AutoScaleFont = False
grph.Application.DataSheet.Cells.Clear
grph.Application.DataSheet.Cells(2, 1).Value = "Apple"
grph.Application.DataSheet.Cells(3, 1).Value = "Nokia"
grph.Application.DataSheet.Cells(4, 1).Value = "Samsung"
'Add the chart column labels.
grph.Application.DataSheet.Cells(1, 2).Value = "1999"grph.Application.DataSheet.Cells(1, 3).Value = "2000"
For r = 2 To 4
For c = 2 To 3
grph.Application.DataSheet.Cells(r, c).Value = Rnd() * 100000
Next
Next
obj_Pre.SaveAs("C:\untitled.ppt")
obj_Pre.Close
obj_ppt.Quit
Also See:
1. Opening a new PPT, adding a picture into it, saving it and closing the PPT
2. OPENING a new PPT, ADDING a title & text into it, SAVING the PPT file and CLOSING it.
3. OPENING an already existing PPT file, ADDING a slide, WRITING tilte & text to the slide, SAVING and CLOSING the PPT
4. OPENING a new PPT, ADDIND a blank slide to it, ADDING table, ENTERING text, SAVING & CLOSING PPT
